
Introduction
The Dashboard provides you with a quick and accurate overview of your data. Here you can find out which proportions of articles come from the different channels or media types, which evaluations these have, and much more. In addition to showingdevelopment over time, there is a word cloud, which provides insight into the most frequently used terms.
The Dashboard provides you with a quick and accurate overview of your data. Here you can find out which proportions of articles come from the different channels or media types, which evaluations these have, and much more. In addition to showingdevelopment over time, there is a word cloud, which provides insight into the most frequently used terms.

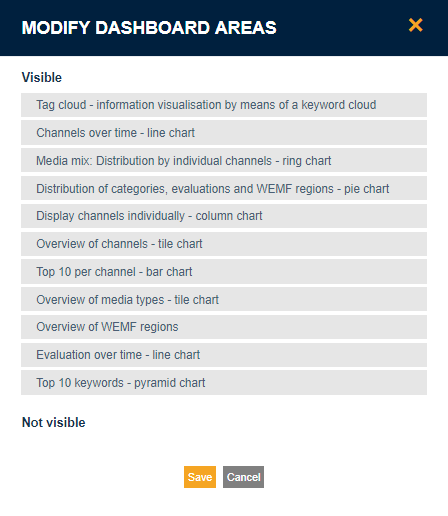
To adjust the Dashboard display, click on the icon ![]() . This opens a menu where you can select which elements are visible and the order they should appear in. Under „Dashboard“, there is the option of opening a drilldown in the same or a new browser window. A drilldown focuses on one part of the analysis. For example, if you click on Print on the doughnut chart by channel, Monitoring will open with the appropriate filter. The selected filter will be modified so that only print articles are shown.
. This opens a menu where you can select which elements are visible and the order they should appear in. Under „Dashboard“, there is the option of opening a drilldown in the same or a new browser window. A drilldown focuses on one part of the analysis. For example, if you click on Print on the doughnut chart by channel, Monitoring will open with the appropriate filter. The selected filter will be modified so that only print articles are shown.